Using Wireshark for Trouble Shooting
Hardware Requirements
There are no particular hardware requirements regarding the PC you run Wireshark on. Basically anything running any version of Windows can run Wireshark. There are also Linux and Mac OS X versions.
The "hardware requirement" that is of most concern is the means of connecting to the network. We typically just connect everything Ethernet to a switch and don't worry about it. However, switches are really unmanaged routers, and they filter traffic. Therefore, your PC will not see traffic passing back and forth between two other devices that are not the PC. In order to see that network traffic using Wireshark, you need to come up with the right kind of network connection.
If your PC itself is one end of the network conversation you wish to capture, for example when running ManageEngine or the Network Discovery Tool, then Wireshark will capture all network traffic to and from the PC however connected. It is when your PC wants to simply "eavesdrop" that you run into problems with the network switch.
A while back, 10BaseT hubs were common. A 10BaseT hub is not as smart as a switch and does not filter traffic. If you have an old 10BaseT hub collecting dust somewhere, you now have a new use for it. It will let Wireshark see all traffic from the PC that goes between any other devices connected to that 10BaseT hub. Beware of devices calling themselves "hubs" but support 100BaseT connections. These are switches.
Since manufacturers of hubs decided nobody should have a use for them anymore, they are generally out of production. A list of devices that have been tested can be found here: https://wiki.wireshark.org/HubReference. (Pay attention to comments. This is a list of tested devices, not strictly working devices, meaning some are tested and reported to not work with Wireshark.) Some of the devices listed can still be found on Amazon or eBay. Finding a 10BaseT hub for sale may require a little searching, but there are other alternatives.
One means of monitoring network traffic is to get a managed switch that supports "port mirroring". One such device we have tested is the TP-LINK model TL-SG105E. Setting it up requires utility software (provided with the switch) and takes a little effort to get configured. But once configured, it works well without any further monkeying around. And it is inexpensive.
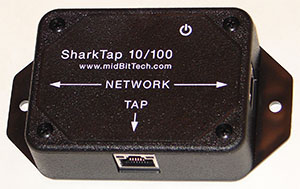
The other means of monitoring traffic is with the use of a device made specifically for use with Wireshark. The "SharkTap" provides two connections for the network pass-through, and a third "tap" connection where you connect your PC running Wireshark. There is no configuration required. It is the simplest way to monitor network traffic, and it is a current production item available on Amazon (as of 2016).
Examples of Using Wireshark
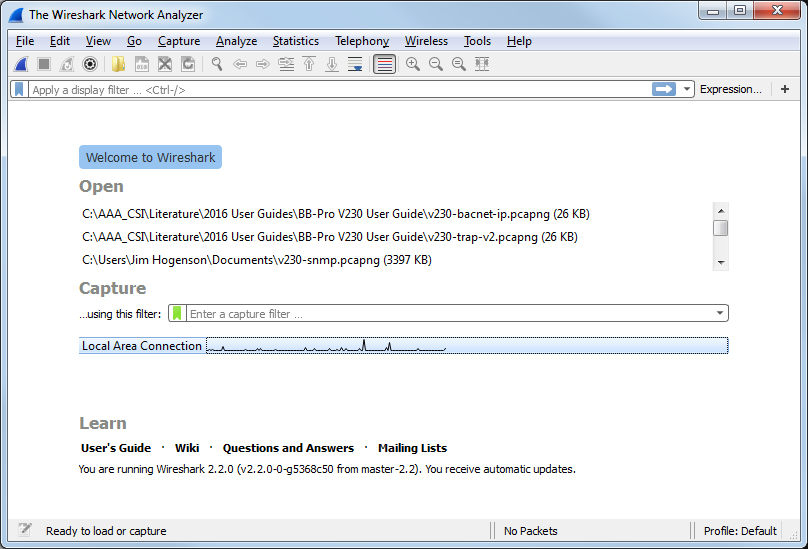
Using Wireshark is fairly easy. Get a copy at www.wireshark.org and install it. Once installed, running it is straight forward. As of version 2.2.0 of Wireshark, the startup screen looks like the following. Double click on Local Area Connection to start capturing network traffic on your PC's Ethernet port. If you have multiple network connections, they will all be listed. Be sure to select the one that represents your Ethernet connection, typically "Local Area Connection".
The screen will look something like the example below once Wireshark starts collecting data. Click the red icon in the toolbar to stop capturing traffic. Control Solutions technical support will often ask for a copy of the Wireshark data when a network issue seems evident. You can save a copy of all of the network traffic captured under the File menu, and you will generally save it to a .pcap or .pcapng file. A Wireshark log with .pcap extension can be posted directly as an attachment in support tickets while .pcapng needs to be zipped first.
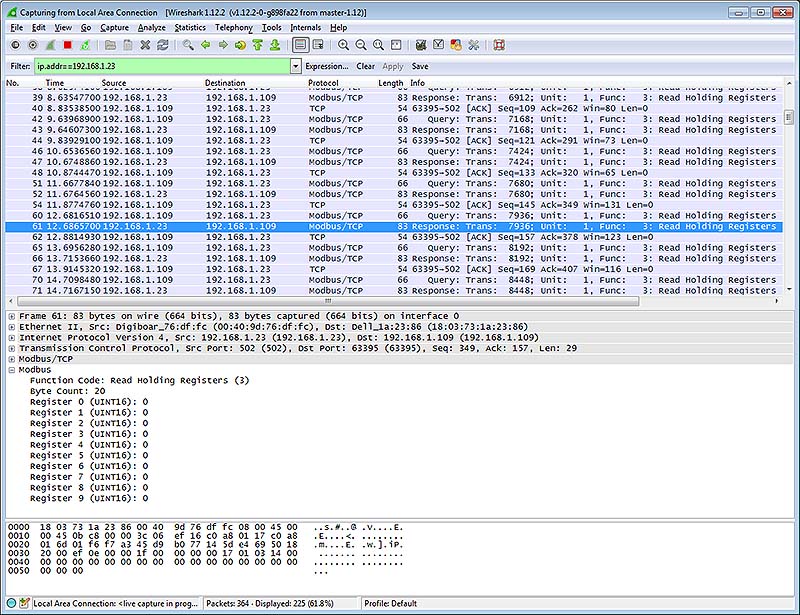
The screen shot below shows Wireshark capturing Modbus TCP traffic between a client and our Babel Buster Pro V210. If you click on a packet, the details of that packet will be displayed in the lower part of the screen. You can expand the tree view to see further detail. In the case of Modbus, we will see function code, register count or data count, etc.
A lot of times you will see a lot of network traffic that is not of interest to you. You can filter network traffic to only display traffic to/from the device you are interested in. Do this by entering "ip.addr==192.168.1.23" in the Filter window as illustrated below. (Substitute your own device's IP address.)
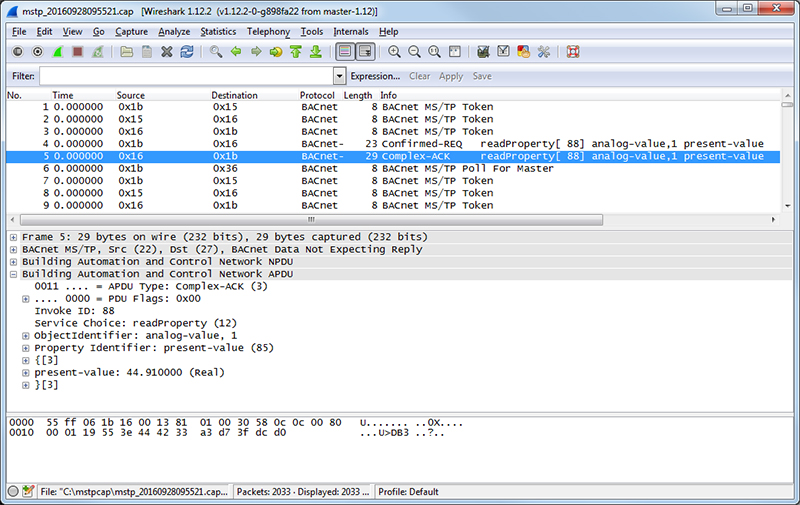
The screen shot below shows Wireshark capturing BACnet IP traffic between a client and our Babel Buster Pro V230. If you click on a packet, the details of that packet will be displayed in the lower part of the screen. You can expand the tree view to see further detail.
Capturing a series of SNMP traffic will look like the example below. In this example, a series of Get requests is being performed by the SNMP client. Click on any one packet and expand the tree structure in the middle window to see full detail of the request or response.
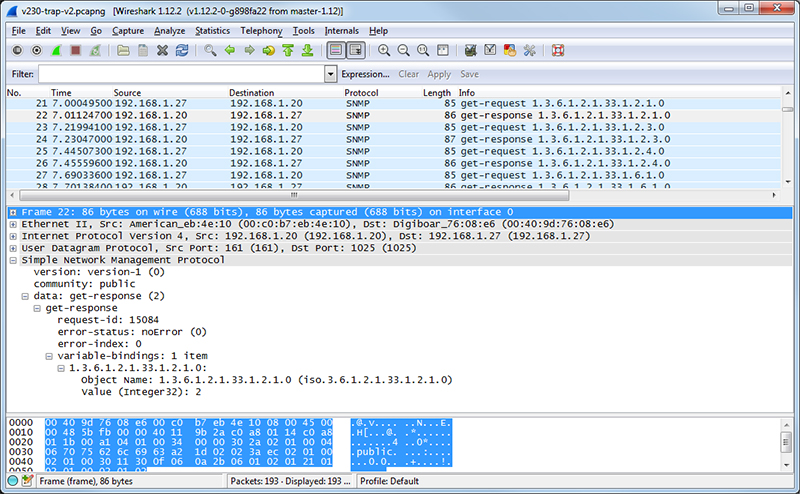
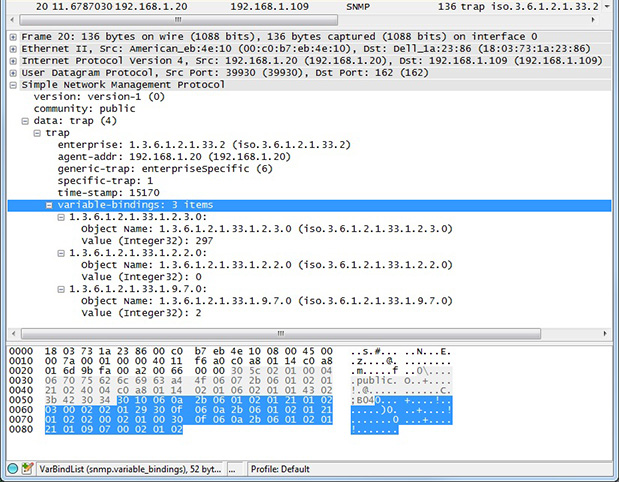
If you are configuring a device to send traps, you may want to look at traps with Wireshark. If you are working on getting a trap receive rule to work in a Babel Buster Pro, you will be interested in looking at traps in Wireshark there, too. A trap from an RFC 1628 UPS is illustrated below, with the trap message expanded in the tree view, as well as the varbinds expanded to show OID and value.